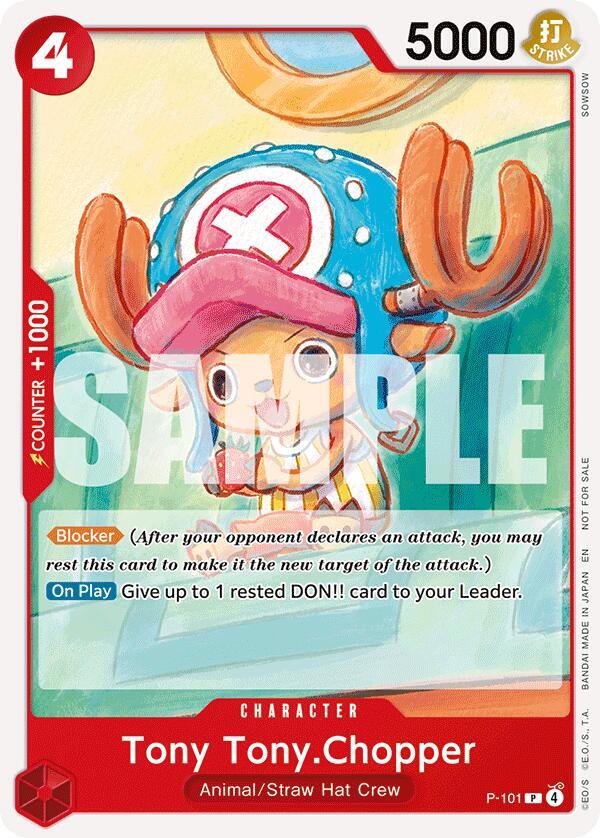
Every week we publish the biggest movers on this site, and the honest truth is that a single week of data can't tell you whether a price move is a real, sustained trend or a short-lived speculative spike. But we've now got four straight weeks of tracked data on the same pair of cards, and that's actually enough to draw a real lesson from — not a theoretical one.
The case study: Chopper and Luffy
Back in mid-July, two promo cards from the same Tournament Pack 2026 Vol. 2 release — Tony Tony.Chopper and Monkey.D.Luffy, appeared together at the top of our trending board. Both kept climbing together for three straight weeks. If you'd only looked at week one, you'd have had no way to know whether that was the start of a real trend or a one-off coincidence of two cards spiking at once.
By week four, the two cards diverged. Chopper kept climbing. Luffy's price actually fell, and its percentage change dropped sharply. Same promo run, same starting conditions, different outcomes once enough time had passed to separate real demand from an initial burst of attention.
The general pattern worth learning from this
- One week of a big percentage move tells you almost nothing on its own. A thin, low-supply market can swing 100%+ on a handful of sales.
- Two or three weeks of the same direction is a real signal, not proof. It rules out a single-sale fluke, but markets can still reverse.
- Divergence between similar cards is often the most useful signal of all. When two cards that started identically start behaving differently, that's the market telling you something specific about each card individually — not just about the release they came from.
- Dollar price matters as much as percentage. A card moving from $0.50 to $2 is a real 300% move, but on a card that cheap, it's easy for a handful of buyers to create a spike that doesn't reflect broader demand. Watch the actual price alongside the percentage.
The takeaway
If you're trying to decide whether a hot card is worth buying into or selling out of, the single best thing you can do is wait for a second and third data point rather than acting on the very first spike. A card that's still climbing three weeks later is telling you something real. A card that spikes once and quietly reverses the next week almost always was speculation, not a genuine shift in value.
You can track any card's full history yourself — every card page includes a 7 day, 1 month, 90 day, and 1 year chart, so you don't have to take our word for a trend; you can watch it play out in real time.